2008 to 2013
Water Samples Collected By Six Ponds Volunteers
File Containing 2008 - 2013 Data
In 2008, the Town reduced the chemical analysis of variables from 19 to 11, in 2011 they dropped 3 of these and added 2 that hadn't been analyzed previously for a total of 9, in 2012 the number was reduced to 8, and in 2013 one was added back in for a total of 9. In other words, there were just 8 variables with data for all 6 years.
Specifically, in 2008 the Town dropped 3 of 5 salt ion variables but kept Chloride and they dropped Hardness, Alkalinity, Sulfate, Color and Free CO2; in 2011 the Town also dropped Chloride, Iron and Manganese but they added TKN and Total Nitrogen; in 2012 the Town dropped Turbidity; and in 2013 they added Tubidity back in for part of the year.
The data file included in this website for these 6 years looks somewhat different than the corresponding one stored on the Town website. On the Town website, variables identifying pond names and years were not labeled consistently, and some variables were ordered differently and positioned differently in different years.
As far as I know, the only analyses of data collected during this 6-year period are contained in summaries that Ed Russell and I wrote for several years. The most recent one from this 6-year period was written in 2011. These summaries commented on the data collected over several years years, and they also included a simple table showing the number of Phosphorus readings collected from particular locations in each pond and compared those with the number of times the Phosphorus readings in each pond had been high (that is, eutrophic). The report from 2011 is included in a section below.
Combined Water Sample data files
File Containing 2008 - 2013 Data Plus Data for 2002- 2006
(The Data Having Variables in Common with 2002-2006)
Once the data file problems mentioned above were fixed, it was possible to analyze results for variables that had been collected for the 11 years from 2002 through 2006 and 2008 through 2013.
There were just 8 variables from 2008 through 2013 which matched up with variables from 2002 through 2006.
_______________________________________________________________
Analyses and Interpretation of the 2002 through 2013 dataset
In 2020, I took another look at the water sample data after I merged the 2002 through 2006 data with the 2008 through 3013 data.
In particular, an analysis of variance program was used to see if there were: a) consistent differences among the ponds in Phosphorus levels and b) consistent differences in Phosphorus levels across years.
Both analyses resulted in statistically significant differences. The first confirmed again that Halfway Pond and Little Long Pond had significantly worse problems with Phosphorus than the other ponds. The second analysis demonstrated that Phosphorus levels in the various ponds varied signifcantly from one year to another and confirmed that 2002 was a bad year and that 2009 and 2010 were also quite bad.
It was interesting to see that the differences among years were more pronounced than the differences among ponds. This suggests that variations in weather conditions from year to year play an important role.
It is possible that there are significant differences for additional variables, but these analyses were limited to Phosphorus since that variable was so prominent in the findings of studies from 1979 through 2013.
_______________________________________________________________
A 2011 Summary of Water Quality Results
This report attempts to convey some of the consistencies that have been found for a number of years, and much of the information in this report is not good news. It should be evident from this report that the condition of water in all 6 of our ponds has gradually been getting worse, that the condition of Little Long Pond should be particularly concerning, and that the condition of Halfway Pond is also serious but for different and less complicated reasons than the condition of Little Long Pond.
Also, over the years, the only pond where nitrate frequently comes up near the critical level is Little Long. This is definitely a trend to be alert to, but it should not be a surprise since the warning signs were there in the 1979 study of this pond as well as in much of the water sample data collected since then.
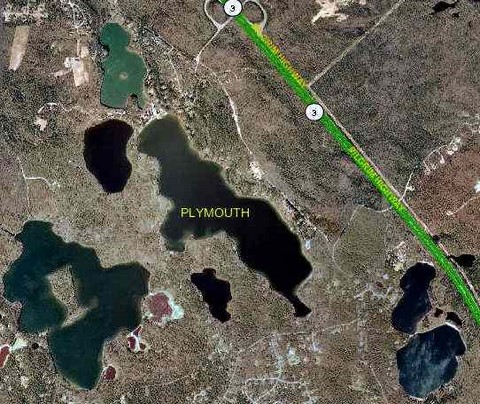
Satellite Images of the Six Ponds Area
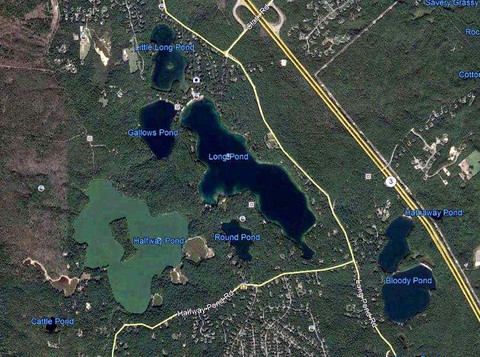
There have been years when algae and pond weed problems were severe in Halfway, and there have been years when Little Long has had these problems.
These problems can be easily seen from the sky.