2014 to Present
Analysis and Interpretation of the Combined Data
An Overview of Six Ponds Water Quality Based on Initial PALS Data
A 2016 Summary of Water Quality Results
A 2023 and 2024 Summary of Water Quality Results
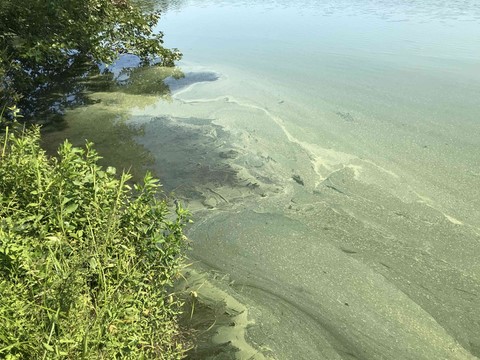
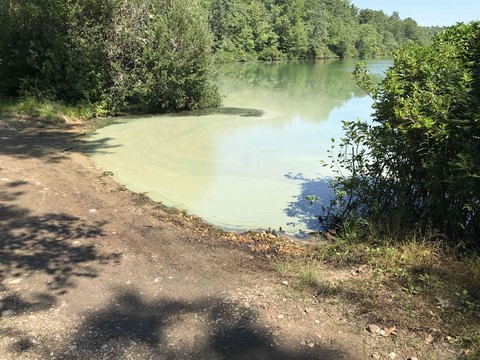
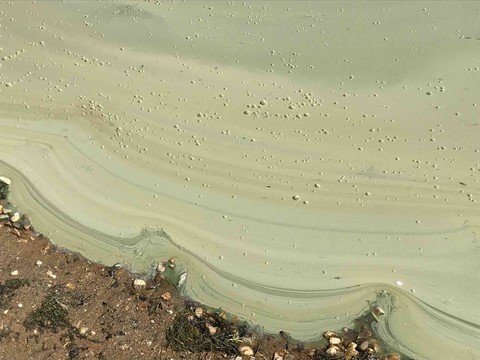
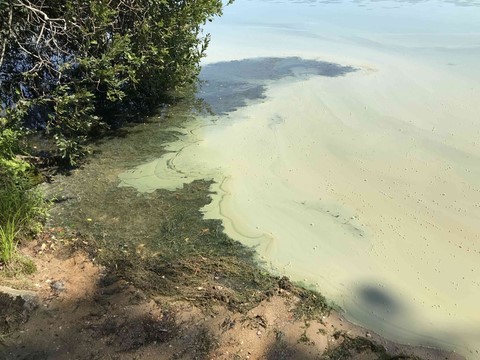
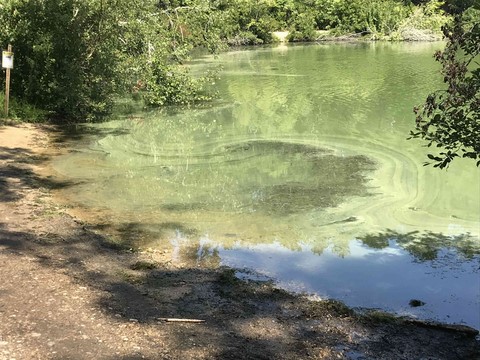
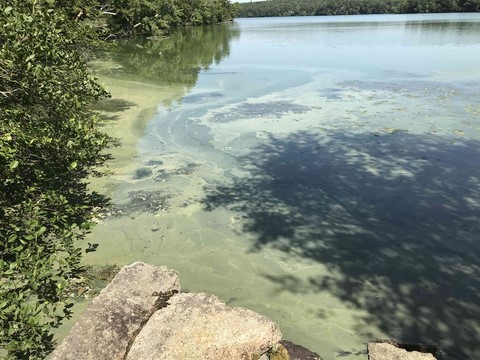
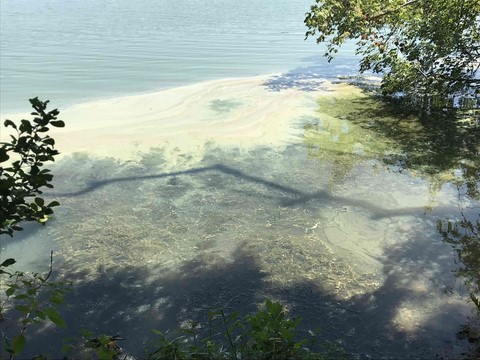
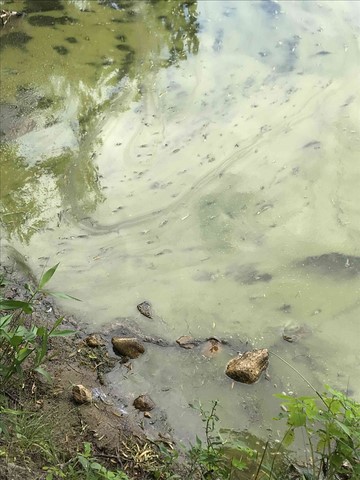
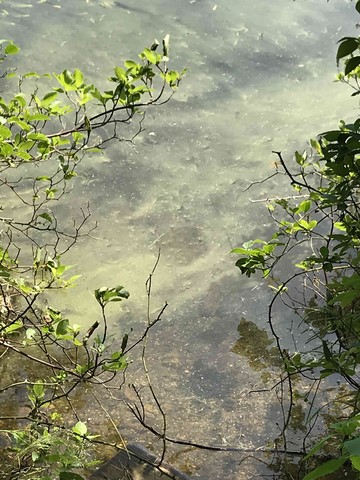
Cyanobacteria Bloom and Pond Weed in Halfway Pond in 2020
Recent Report on the Health of Halfway Pond
<Plant Survey -2015Water Samples Collected By Six Ponds Volunteers
In 2014 the Town of Plymouth Department of Marine and Environmental Affairs received grant funding from the Massachusetts Environmental Trust. This funding enabled the Town and Project Partner UMASS Dartmouth - School of Marine Science and Technology (SMAST) to commence the Plymouth Ponds and Lakes Stewardship Program (PALS) and Pond Atlas foo water quality analysis and reporting in 39 ponds throughout Plymouth.
Starting in 2014, data for 18 variables were collected according to the new PALS protocol (some by visual observation, some with devices, and some from analysis of water samples) Several variables were new and a few had been included previously, and no salt ion variable was recorded after 2014. The data protocol was quite different from that which had been used by Six Ponds in earlier years.
Six Ponds data for 2014 through 2019 was extracted from the PALS data for a larger number of ponds (39). Then it was necessary to reorganize the data for each year so the variables were aligned across all 6 years. Some variables were recorded in different orders in different years, and it required a lot of careful work to get everything aligned correctly.
Combined Water Sample Data Files
The data for 2014 through 2019 were merged with the data for 2002 through 2006 and with the data for 2008 through 2013. Starting with the database structure for 2002 through 2006, new columns were created in the merged database for variables that were introduced in the later databases.
In addition, pond names were recorded as necessary for consistency and a column was added for the year because sampling dates were coded differently in different years.
Although 18 variables were observed or analyzed from water samples from 2014 to 2019, only 3 of these variables were included all the way back to 2002-- pH, alkalinity and Phosphorus (TP or P). Since there were a lot of cases where data was missing for at least one of these variables, only the cases with data for all 3 of these variables were selected for analysis.
Analysis and Interpretation of the Combined data
In 2020, data for the 3 variables included from 2002 through 2019 were analyzed with an analysis of variance program.
In particular, the analyses looked for differences among the ponds in pH, Alkalinity and TP levels, and the analyses revealed statistically significant differences among the ponds for all 3 of these variables.
Gallows Pond and Round Pond exhibited somewhat lower pH and much lower Alkalinity than the other ponds. These results were consistent with the reasons that these ponds were selected for the liming experiments done in late 1980s. These results are also consistent with information indicating that the benefits of liming last just a few years. (See the liming experiments discussed in the first time period covered in this website.)
The analysis again confirmed that Halfway Pond and Little Long Pond had worse problems with Phosphorus than the other ponds had.
AOV of 3 Variables by Pond and by Year
An Overview of Six Ponds Water Quality Based on Initial PALS Data
PALS Data collected in 2020
A 2016 Summary of Water Quality Results
A 2023 Summary of Water Quality Results
The PALS data for 2024 and several earlier years was taken from palsandhistoricponddata-2024update-2.xlsm
The Phosphorus and Nitrogen data extracted from the PALS file was 2017to2024tptn-lp2.pdf
Cyanobacteria Bloom and Pond Weed in Halfway Pond in 2020
Recent report on the health of Halfway Pond
Around 1980 the Town of Plymouth commissioned studies of 41 ponds in Plymouth which included assessments of water quality. The year-long study of Halfway Pond identified it as ultra-eutrophic, and many Phosphorus readings taken throughout that year were well above the eutrophic level.
Halfway Pond has few year-round homes, the gravel roads around it are not heavily traveled, and massive quantities of spring water flow from it into the Agawam River. But, around the pond, there are about 25 acres of cranberry bogs which draw water from the pond and empty water back into it.
Analysis of fluctuations in Phosphorus measurements taken in Halfway Pond from 2002 to 2019 did reveal statistically significant differences, but there is no clear pattern to the differences even though the average readings in 2017 and 2019 were slightly lower than those in some earlier years. In any event, the average Phosphorus level over these nearly 20 years was roughly twice the eutrophic level.
Analysis of fluctuations in Turbidity within Halfway Pond during these same years also revealed statistically significant differences, but there is no pattern whatsoever to the differences. However, the correlation between Turbidity and Phosphorus was moderate and statistically significant which suggests that years with higher Phosphorus are also likely to be years with more severe algae blooms.
For many years people have observed that substantial quantities of water flow into Halfway Pond from the cranberry bogs throughout the year. In a study of Halfway Pond conducted during the summer of 2003, Phosphorus readings in water that flowed out of the bogs ranged from 3 or 4 times to more than 10 times the eutrophic level. This flow from the bogs continues today, and it undoubtedly adds nutrients to the pond every day. Moreover, when the bogs are flooded for weeks at a time several times a year, the release of this water into the pond is certain to flush accumulated nutrients into the pond.
Conclusions: It is not evident from available data that recent changes in the cultivation of the Halfway Pond bogs have produced significant benefits to the health of Halfway Pond. Algae and pond weed blooms occur off and on as they have for over a century, and Phosphorus levels have fluctuated over the years but remain high. What does seem clear, however, is that the health of Halfway Pond is unlikely to improve without more extensive measures being undertaken. Specifically, the negative impact of the bogs on the health of Halfway Pond will not be substantially reduced until all of the bogs are taken out of service and water no longer flows directly from these bogs into Halfway Pond.
Written by Dorothy and Leighton Price, September 2020
___________________________________________________________